Swiftly
Empowering transportation IT teams to monitor and troubleshoot malfunction devices, dropped 20 percent of maintenance time.

Collaborated with Adam Cath (Product Manager), Dave Maltzan (Technical Product Manager), Tyler Ball (Senior Engineer Manager), Joseph Luk (Full-stack Engineer)
Background
Swiftly is a B2B transportation data platform powering reliable transit for 100+ agencies across the U.S. and Europe. In 2022, Swiftly expanded into a new user segment: agency IT teams, who managing and monitoring real-time hardware and software data on buses.
Challenge: Took 36+ hours in bus maintenance using manual monitoring.
Agency IT teams used slow, manual tracking and paper records. Hardware issues took days to resolve. This also took a toll at Swiftly's client support requests increased.
We interviewed staff and visited sites. We found two main problems.
Each hardware system used a separate dashboard—over eight in total. No single overview existed.
Each platform sent its own alerts, so staff wasted time sorting through notifications.
Long maintenance times lowered trust and safety. For example, a broken security camera might go unnoticed. In addition, data delays made future predictions unreliable.
Our Solution
I designed a dashboard that shows all real-time data and flags urgent issues. IT teams can now find and fix problems without support. Maintenance time dropped 20 percent. Support emails fell.
Impact
Cut maintenance response time by 20 percent.
Reduced support requests, so IT teams focused on higher priorities.
Increased system reliability for riders and agencies.
Process - Vision design
We started with a blank slate. I wanted to know what mattered most to the people who would use it. I met with multiple agency IT staff. I asked about their daily work and what slowed them down. Internally, we built a vision prototype to align internal roadmap. Their feedback shaped every screen.
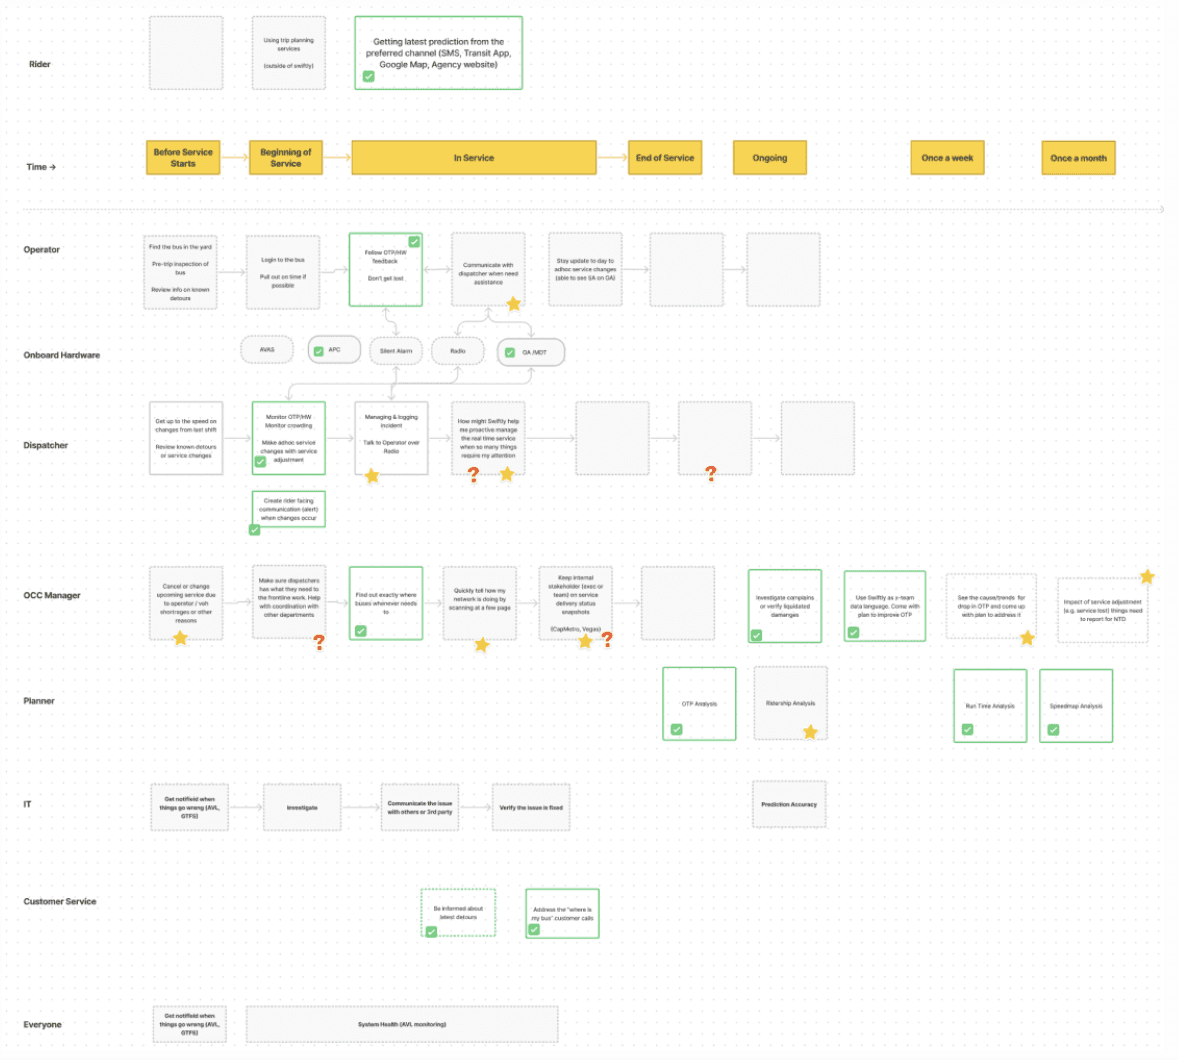
Mapped user journey to build alignment
I worked with PMs and designers to map a transit agency’s daily and weekly workflows. I met with IT staff to learn what slowed them down. We built a vision prototype and used their feedback to shape every screen and set our roadmap.
Vision prototype to align North-Star roadmap
I ran a vision workshop with PMs, designers, and engineers.
We used user research and stakeholder input to pick the best product bets for the next year. I worked with back-end developers to plan hardware data flows. The team agreed on a single North Star and set clear priorities.
Interviews, A/B Testing, and Usability benchmark
Interviewed users and tested multiple versions. Some questions we asked:
What do you notice first?
How fast can you find a broken device?
We benchmarked against the three-color status to evaluate how fast the design let users triage at a glance.
In addition, I brought design trade-offs and user feedback to team reviews to drive consensus on a scalable, user-aligned solution.


Released prototype to five agencies - Reduced maintenance time by 20 percent.
In addition, Client success teams used it to troubleshoot missing data. When a dispatcher could not find a bus, the tool showed if a broken tracker was the cause.
Scoping MVP for larger audience
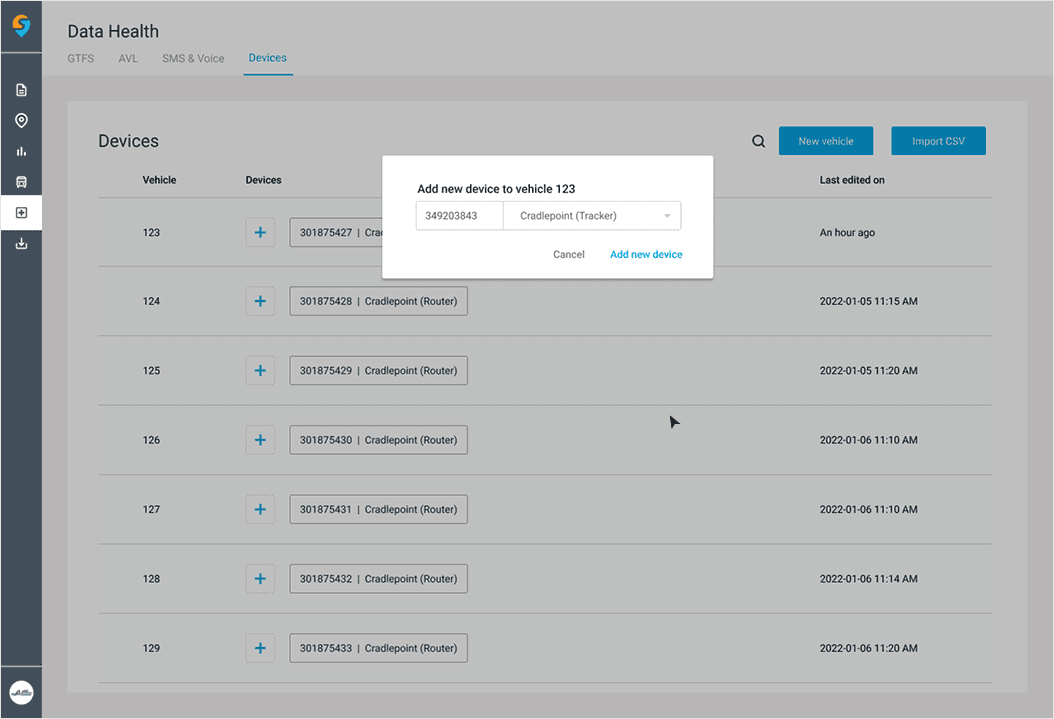
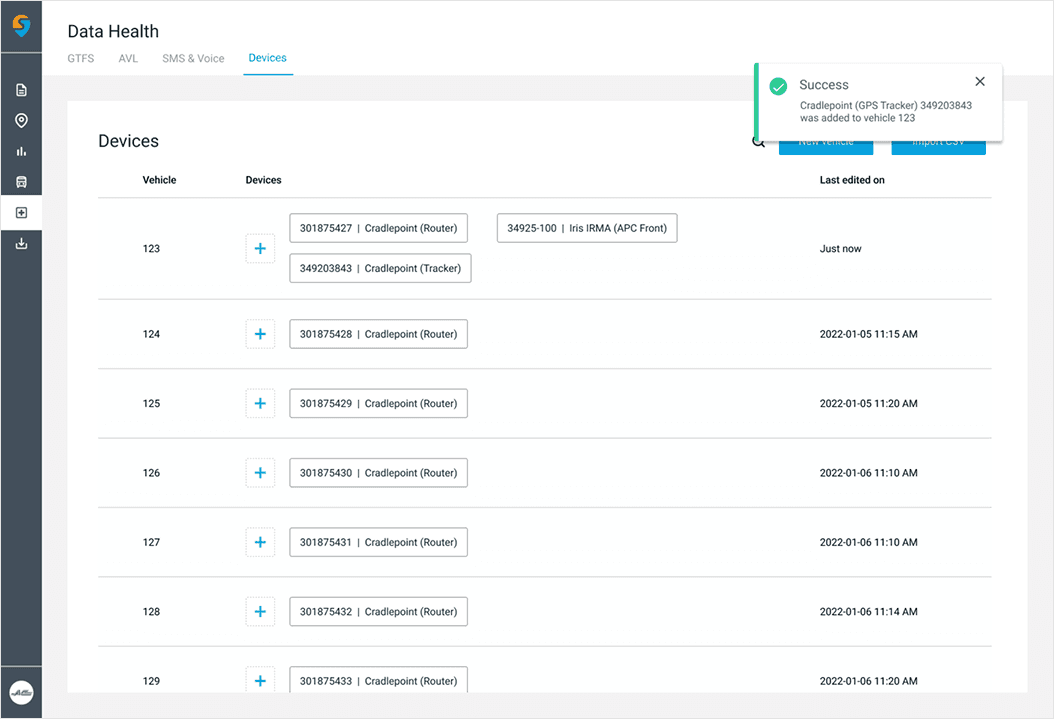
After aligned with stakeholders on product vision, we prioritized two high-impact and necessary user flows for MVP: add and remove a device from a vehicle. These tasks are the based choices on user needs and business goals.
User flow: Add a new device


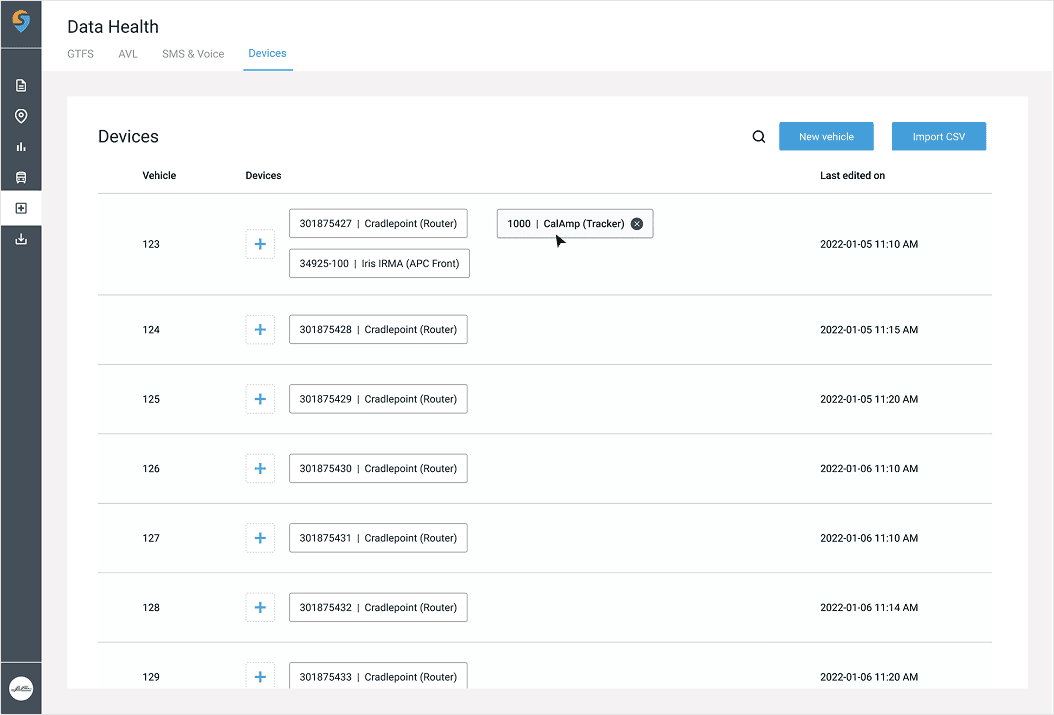
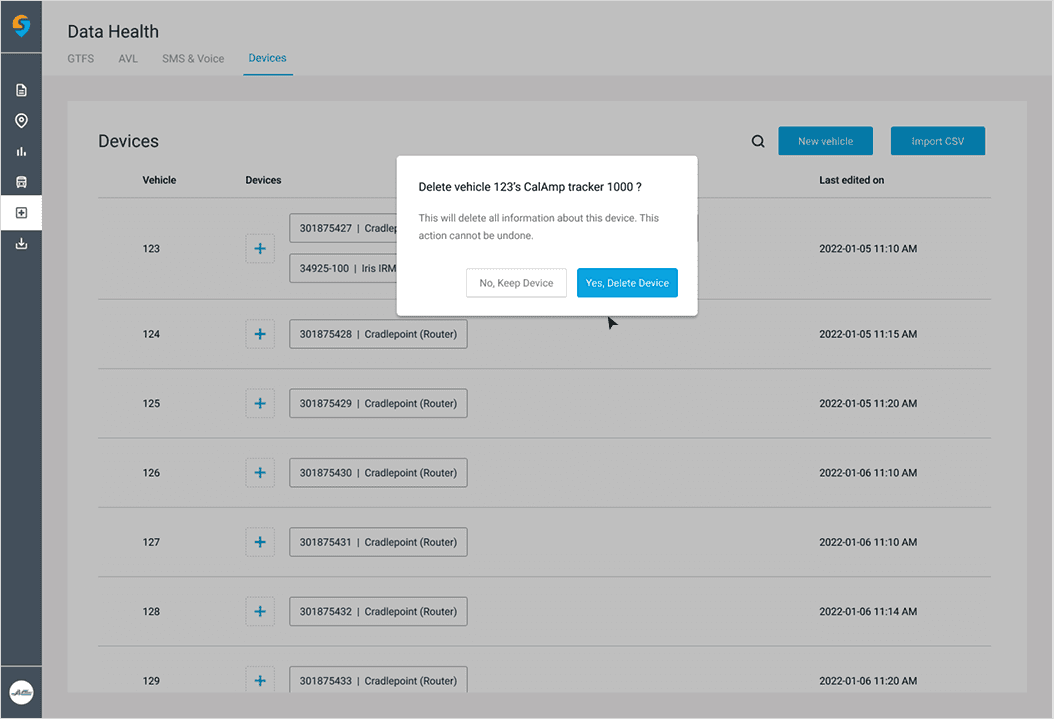
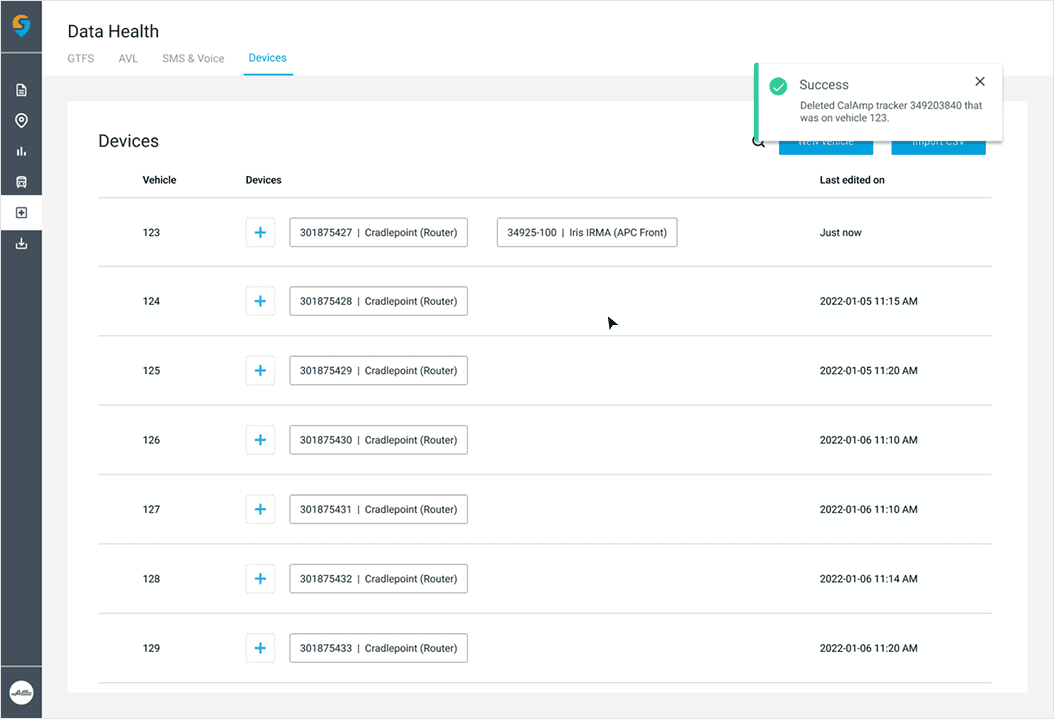
User flow: Delete a device
Retrospective
Build alignment early and ask, “What happens if we don’t solve this now?” This helps the team set clear priorities and goals.